Showing posts with label GDP. Show all posts

Wednesday, December 26, 2012

How Accurate is the CBO?

Politicians and pundits often talk about budget projections from the CBO. Depending on how the CBO's projections mesh with the commenter's worldview, the projections are either the best possible from the nation's top budget economists, or they're crap, constrained by Congressional rules until they're useless. So just how accurate is the CBO?

A comment over at Bob Murphy's Free Advice inspired me to check out both the 2001 and 2012 "Budget and Economic Outlook" reports from the CBO. While I've got them out, I thought it'd be interesting to compare the CBO's old projections with what actually happened. Conveniently, the 2001 and 2012 reports overlap in 2011, so that's the year I'll compare.

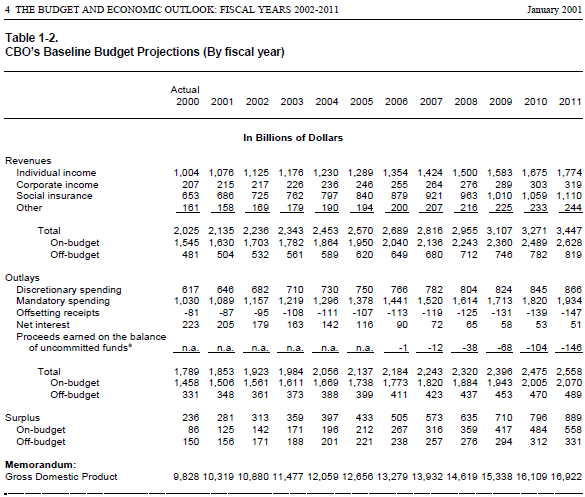
First, Table 1-2 from the 2001 report (page 24 of the PDF), including the 2001 projection for 2011 in the far-right column:


Then, Table 1 from the 2012 report (page 6 of the PDF), including the actual numbers for 2011 in the far-left column:


How accurate was the CBO for 2011? Not at all.

Revenue: The CBO projected revenues of $3.4 trillion, while actual revenues were a full third lower than the projection, at $2.3 trillion.

Outlays: The CBO projected outlays of $2.6 trillion, while actual outlays were a full trillion higher at $3.6 trillion.

Deficit: The CBO optimistically projected an $889 billion surplus for 2011. The actual deficit was $1.3 trillion, a $2.2 trillion difference. (Of course, this error is just the combination of the two errors above. Still, it's interesting to contemplate a United States with an $889 billion surplus!)

GDP: The CBO projected a $16.9 trillion (nominal) GDP, but actual GDP was only $15.3 trillion.

Should we just write off the CBO entirely then? I don't think so. On the revenue side, the CBO could not have accounted for the Bush tax cuts or the revenue lost from the Great Recession. On the spending side, they could not have accounted for the war spending or, again, for the Great Recession, or for Obama keeping stimulus-level spending even after the stimulus was over.

I think the takeaway here, as we approach the end of the fiscal cliff negotiations, is that all projections for a decade in the future need to be taken with a grain of salt. Stuff is going to happen that no one expects. Decide for yourself what that should mean for current policy.

A final note: Some might look at the four areas above and say that in each area, the projections ended up being more optimistic than reality. I think that's a mistake. First, the CBO projected in 2001 that 20% of 2011's GDP would be soaked up by federal taxes, when it was actually only 15%. I think that's a good thing, despite what it means for the deficit.

Second, the GDP numbers above are nominal, meaning they include both real GDP and inflation. If nominal GDP is lower than expected, the cause might be lower real GDP (bad) or lower inflation (good). We've had both in recent years, so I'd have to dig deeper into the reports to see which effect dominates, and that's more playing with PDFs than I'd like to do tonight.

Monday, October 10, 2011

Richer than Ever Before

There has never been a better time to be human. Even in the depths of the global Great Recession, average per capita incomes are higher than they have been for most of human history. This is true in rich and poor countries alike, and within developed countries it's true at all income levels. The rich are getting richer while the poor and middle class are getting richer too!

It's true, the last couple years have been a struggle for many around the world. Lots of people, including me, lost their jobs to the Great Recession. However, despite the hardships of the last couple years, we are still living in the greatest era in human history.

According to the World Bank, world GDP per capita in 2010 was $6,035, which is 99.77% of 2008's peak of $6,049. (All dollar amounts in this entry are expressed in constant 2000 US dollars.) GDP per capita in 2010 was 3.04% higher than in 2009, nearly twice the 1970-2008 average of 1.60% growth. The world economy is well on the way to recovery, and there's every reason to expect 2011's GDP per capita to be higher than ever before.

The Great Recession is clearly visible in the graph to the right, as are a handful of other global recessions and slowdowns over the past forty years. The Great Recession is clearly the sharpest decline the world has seen lately, and GDP per capita in 2009 was less than it had been in 2006. Even so, incomes were 2.59% higher in 2009 than in 2005. Indeed, in 2006, for the first time in human history, the average human being earned $16 per day. The average person has not earned less than $16 per day since 2005. To put that another way, the five most prosperous years in human history so far were 2006, 2007, 2008, 2009 and 2010.

This is especially true for the low- and middle-income countries, who as a group have not seen a decline in GDP per capita since 1983. The 2010 GDP per capita of $1,834 was the highest ever recorded for this group of countries, and a full 6.26% higher than the previous record set in 2009. The past decade in particular has seen incredible growth, averaging 4.53% growth in GDP per capita per year. Income per person in 2010 was three times higher than in 1969.

An income of $1,834 per year might not sound like a lot to those of us in first-world countries. Indeed, it's just a little more than $5 per day. But 2010 was the first year ever when the average person in these countries earned $5 per day. It's not a lot, but it's more than they have ever had before. As an indication of just how fast the poor countries are joining the rich, the $4-per-day threshold was first passed as recently as 2006, and the $3-per-day threshold in 1998.

The Great Recession has hit high-income countries much harder than low- and middle-income countries. GDP per capita in high-income countries was still 2.23% lower in 2010 than the 2007 peak of $28,095. Per capita incomes were higher in 2006, 2007 and 2008 than they were in 2010, and even 2005 was higher than 2009.

However, the hardships of the last few years have not undone the prosperity we have achieved. At the lowest point of the Great Recession, in 2009, income per person in high-income countries was $26,807. This was a full 6.92% higher than the heights of the dot-com bubble in 2000. As this video posted by Greg Mankiw notes, "Even after the worst financial crisis since the 1930s, US per capita income is still higher than at the peak of the 1990s boom."

We are also on the road to recovery; incomes grew 2.47% between 2009 and 2010. If we achieve a similar level of growth in 2011, we will set a new record for the most prosperous year ever. Even if we don't set a new record, GDP per capita in the high-income countries will still be twice what it was in the mid-1970s.

Despite the great recession, incomes are at or very close to the highest they have ever been for most people around the world. This is especially true for poorer countries, but it's also true for the recession-ravaged wealthy countries. No generation in human history has had it better than we do. There has never been a better time to be human.